Hi, my name is Jiazan. I’m a data analyst/data scientist with an interdisciplinary background in business and data science. I have practical experience in business data analysis (especially in social media data analysis for marketing), business intelligence, and data visualization. Meanwhile, the solid programming for data science skill set I got from NYU equips me with expertise in Python, SQL, and Tableau. I’m eager to apply data science techniques such as machine learning, NLP, and LLM in the business field.
Skillset:
Languages: Proficient in Python (Pandas, NumPy, Scikit-learn, GeoPandas, Natural Language Toolkit, TensorFlow), SQL (MySQL, Google BigQuery), basic knowledge in JavaScript and HTML
Visualization: Tableau, Matplotlib, Seaborn, Plotly, D3.js
Data Science Techniques: Machine Learning, PCA, Network Analysis, Time Series Analysis, Natural Language Processing, A/B Testing
Others: Flask, SPSS, Microsoft Excel(VLOOKUP, Pivot-table), PowerPoint
Recent Work
Interactions among Echo Chambers on Twitter
The project analyzed the echo chamber phenomenon on Twitter, with sentiment analysis, network analysis, and an innovation of using ChatGPT API for stance detection to shed light on the structure of echo chambers and features of influential nodes.
Tools: Python

Machine Learning for Predicting Restaurant Inspection Grades
In this project I trained machine learning models with urban features to predict restaurant inspections grades, and help interpret the contribution of urban features to the restaurant's sanitation condition.
Tools: Python
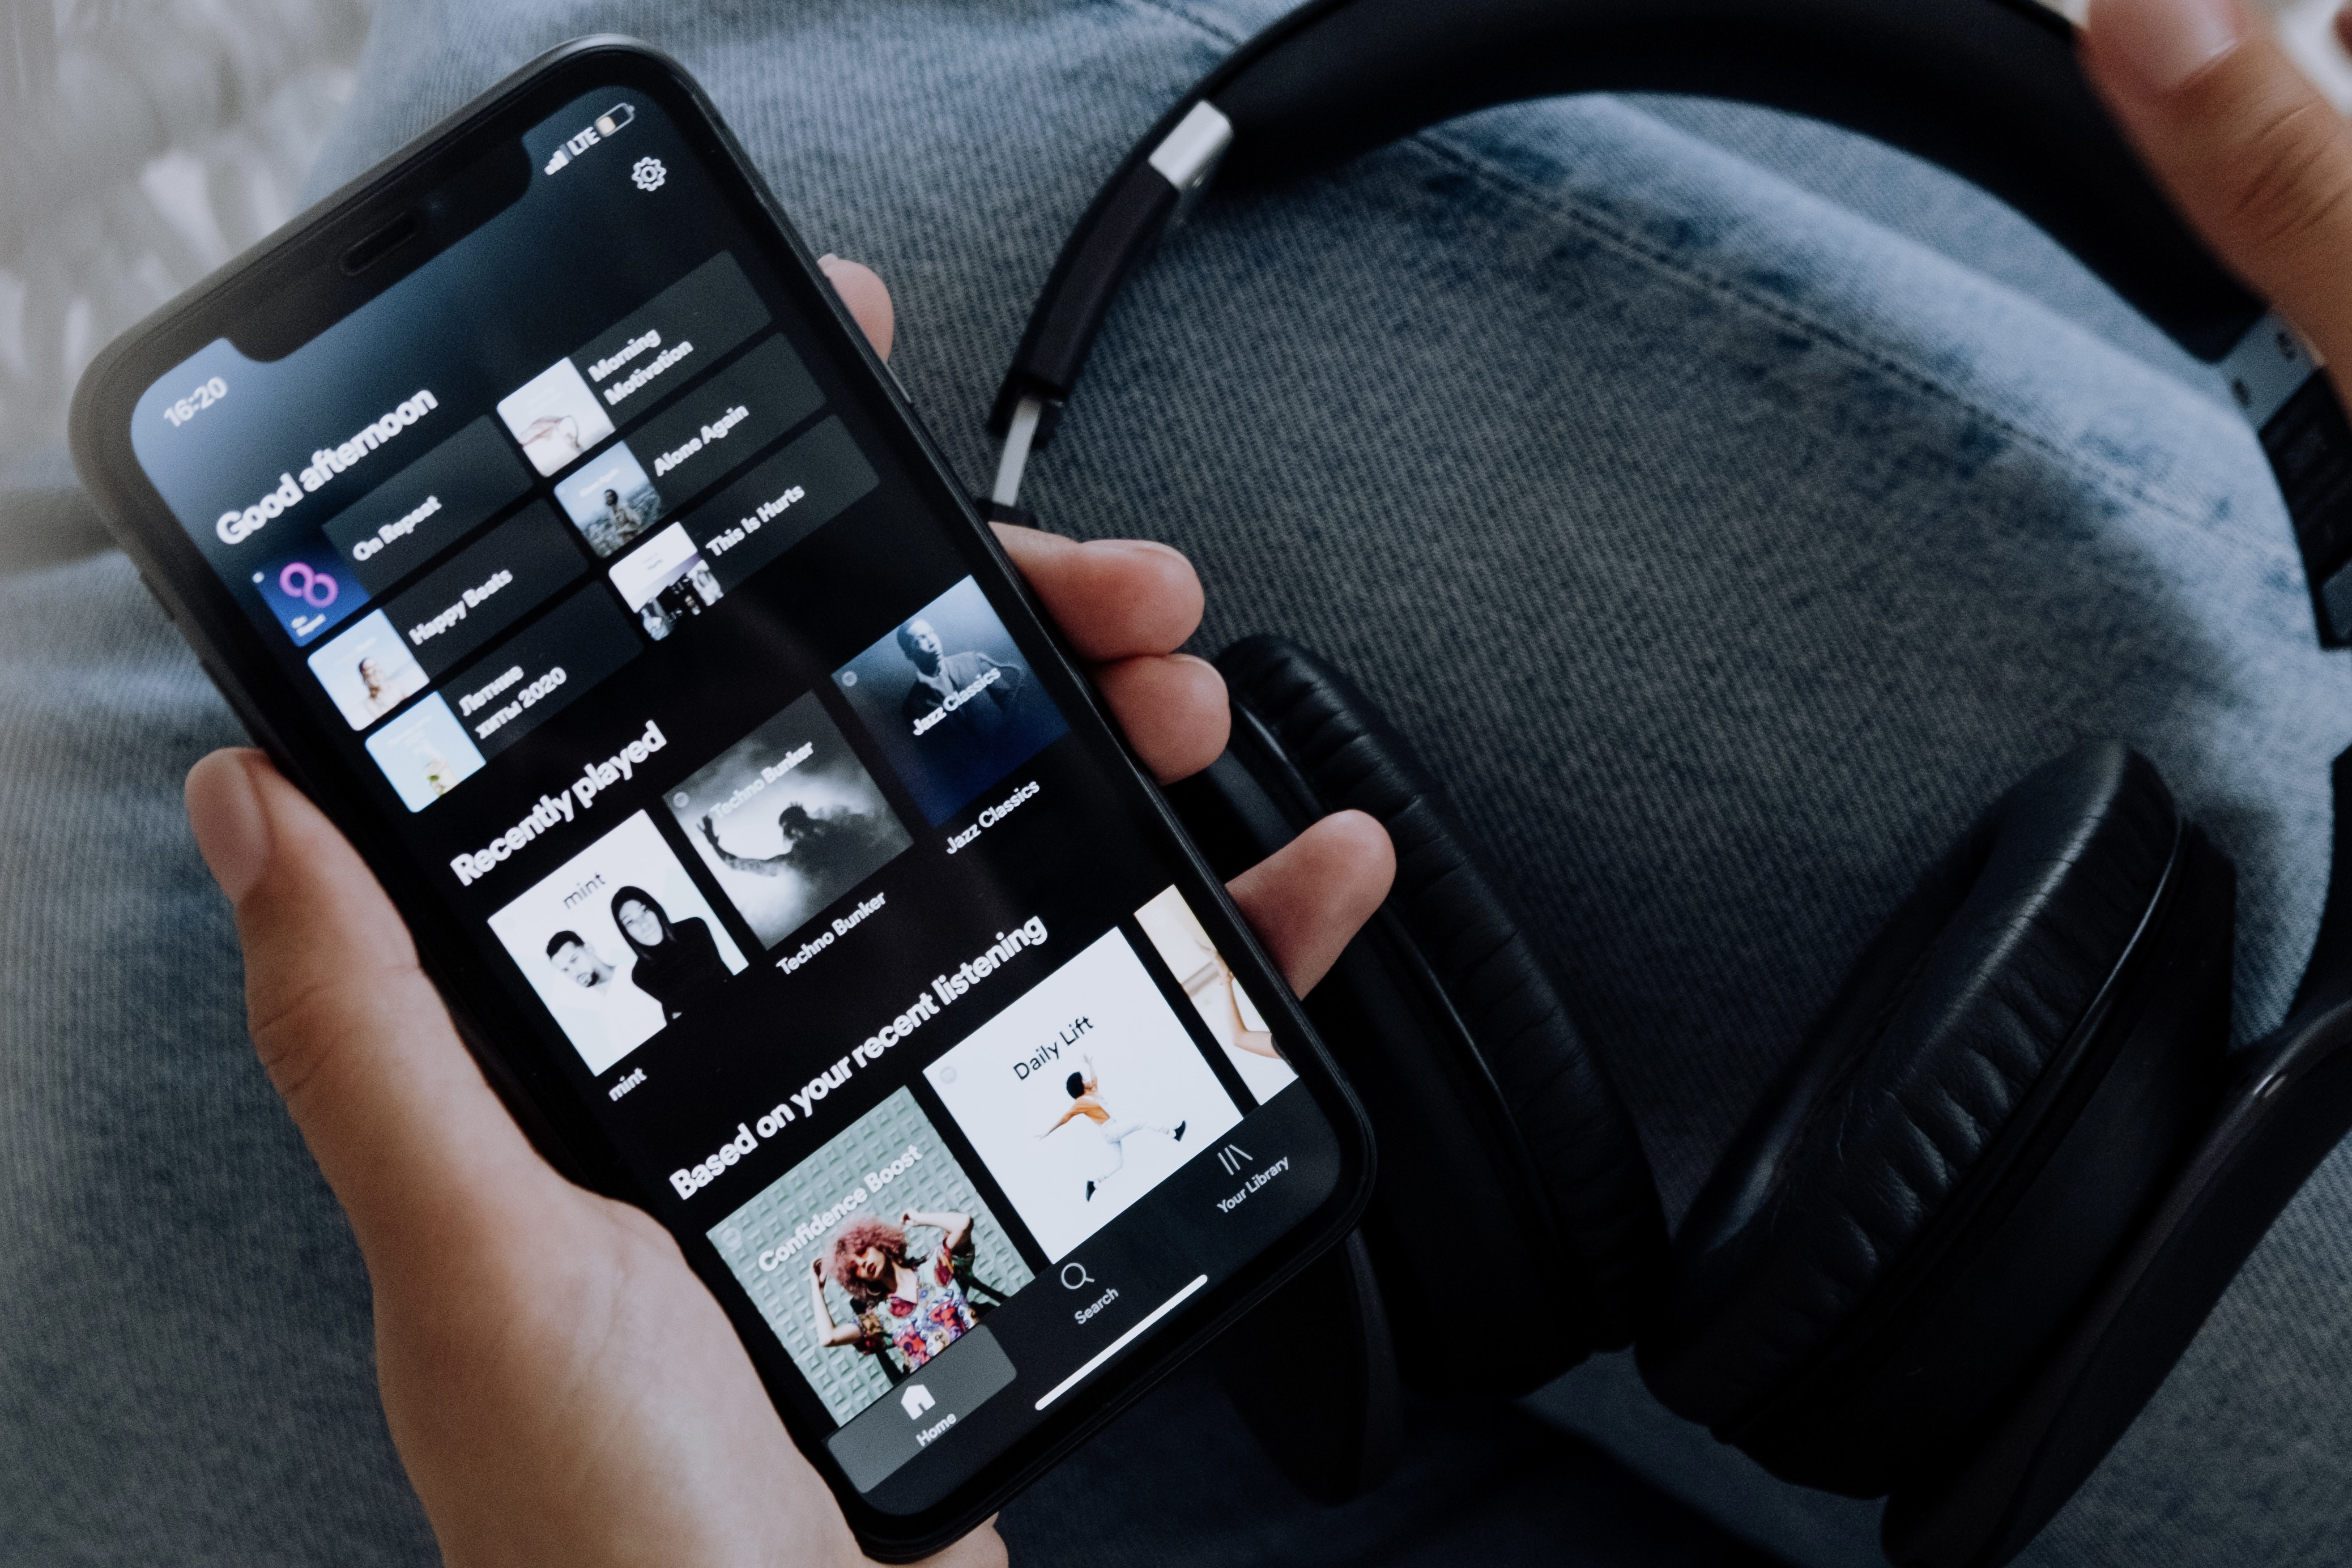
Spotify Playlist Analysis Platform
This is a platform used to analyze user's Spotify playlist data, including user's favorite artists, genres, and audio features with Spotify API. It helps us know better about user's music preference and taste so that software developer could develop state-of-art music recommendation algorithms.
Tools: Python, Git, Flask, HTML

Data Visualization with Tableau
Here's my Tableau Public Profile with Data Dashboards for retail transactions data and Spotify Charts data (Since I'm a fan of BTS, I visualize BTS streams data on Spotify here for the visualization project). Hope you enjoy!
Tools: Tableau
Get In Touch
Feel free to contact me. Looking forward to connecting!